![cascade-lockup-dark.png]](https://knowledgebase.cascadedebt.com/hs-fs/hubfs/Logos%20(new)/cascade-lockup-dark.png?height=40&name=cascade-lockup-dark.png)
Opening it
Click the document icon in the left-hand rail. Analytics Pro has three pages: Portfolio, Quarterly Vintage and Implementation.
Portfolio
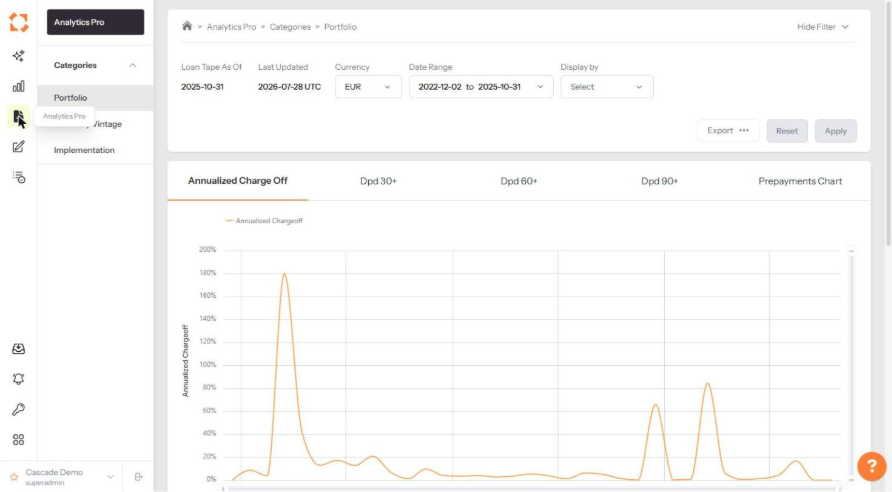
Portfolio-level performance curves over whatever date range you choose.
|
Tab |
Shows |
|
Annualized Charge Off |
Charge-offs expressed as an annualised rate over time. |
|
Dpd 30+ |
The proportion of the book 30 or more days past due. |
|
Dpd 60+ |
The proportion 60 or more days past due. |
|
Dpd 90+ |
The proportion 90 or more days past due. |
|
Prepayments Chart |
Prepayment behaviour over the period. |
Set the Date Range, Currency and Display by options in the filter bar and click Apply. Export produces the underlying data.
Quarterly Vintage
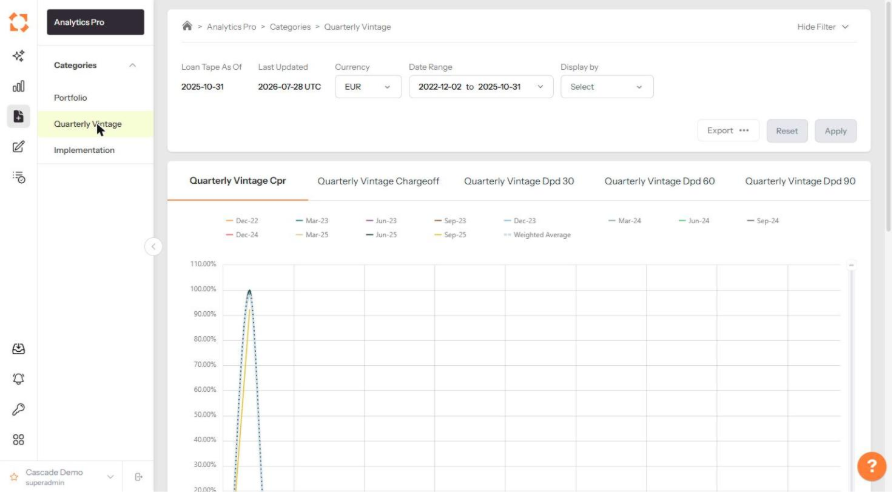
The same metrics, but sliced by origination quarter rather than calendar time. Each line is a cohort, tracked from its own month zero, with a weighted average overlay.
|
Tab |
Shows |
|
Quarterly Vintage Cpr |
Conditional prepayment rate by origination quarter. |
|
Quarterly Vintage Chargeoff |
Charge-off by origination quarter. |
|
Quarterly Vintage Dpd 30 / 60 / 90 |
Delinquency at each threshold, by origination quarter. |
Why vintage analysis matters
A portfolio-level delinquency rate can fall simply because the book grew — new loans are not yet delinquent, so they dilute the ratio. Vintage curves remove that effect: each cohort is measured from its own origination, so you are comparing like with like. If each successive quarter's curve sits above the one before it at the same month on book, underwriting is deteriorating regardless of what the headline number says.
Read the curves at a consistent point — month 6 or month 12 on book — rather than at their endpoints, since recent vintages are necessarily shorter.
Implementation
Implementation is not a filing cabinet — it is the specification for this page. It documents exactly what each chart calculates: which loans and records it counts, how dates are bucketed, every input and where it comes from, the formula, the parameters configured for your deal, and how the page's filters, date range and currency selector change the result.
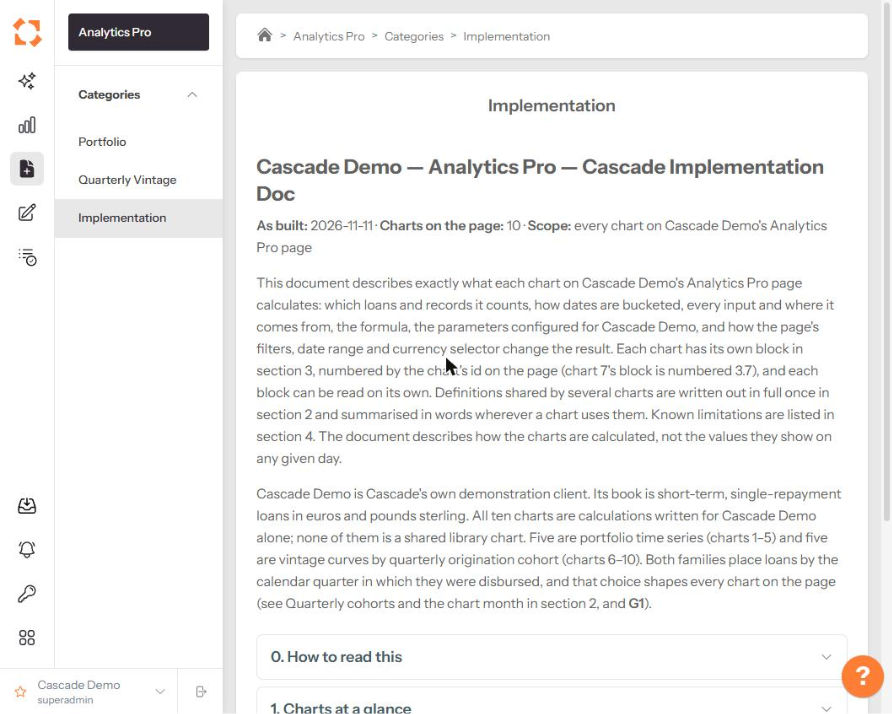
Shared definitions are written out once and referenced by each chart, each chart has a self-contained block numbered to match its position on the page, and a Gotchas section lists known limitations. Read it before quoting a vintage figure externally. See Implementation: How Everything Was Built for the full guide.
Analytics or Analytics Pro?
|
Question |
Where to look |
|
How big is the book and how is it trending? |
Analytics > Risk > Key Indicators |
|
What does the book look like cut by status, product or geography? |
Analytics > Risk > Stratifications |
|
Are charge-offs rising across the portfolio? |
Analytics Pro > Portfolio |
|
Is recent origination performing worse than last year's? |
Analytics Pro > Quarterly Vintage |
|
What happens to cashflows if defaults double? |
Analytics > Risk > Cashflow Simulation |