![cascade-lockup-dark.png]](https://knowledgebase.cascadedebt.com/hs-fs/hubfs/Logos%20(new)/cascade-lockup-dark.png?height=40&name=cascade-lockup-dark.png)
Most analytics platforms ask you to trust the number. Cascade writes down how it got there. Every module carries an Implementation section containing a document, generated from the code itself, that states exactly what was built — field by field, rule by rule, including where a rule does not do what its label suggests.
In Manage this is explicit, because the implementation sits directly beside the thing it implements. Facility Details > Details is Cascade's extract of the executed legal documents — the agreement's own language, organised. Facility Details > Implementation is what Cascade built from it. One is the intent; the other is the delivery. Reading them against each other is how you verify that the facility running in production is the facility that was signed.
These documents are not marketing summaries and they are not hand-written notes that drift out of date. They are produced from the mapping and calculation code, versioned with a change log, and regenerated when the code changes.
Where the three Implementation sections live
|
Module |
Path |
What it documents |
|
Analytics |
Analytics > Risk > Implementation |
How your raw data was mapped into the Cascade model. |
|
Analytics Pro |
Analytics Pro > Categories > Implementation |
What every chart on the Analytics Pro page calculates. |
|
Manage |
Manage > Monitor > Facility Details > Implementation tab |
What is computed for one specific facility — borrowing base, eligibility, concentration, covenants, dashboards and audits. Sits beside the Details tab, which holds the legal extract it implements. |
They answer different questions. Start with the one that matches the question you are actually asking.
Analytics > Implementation — the Post-Mapping Summary
This is the data lineage document. It explains how the file you send Cascade became the portfolio you see in the platform.
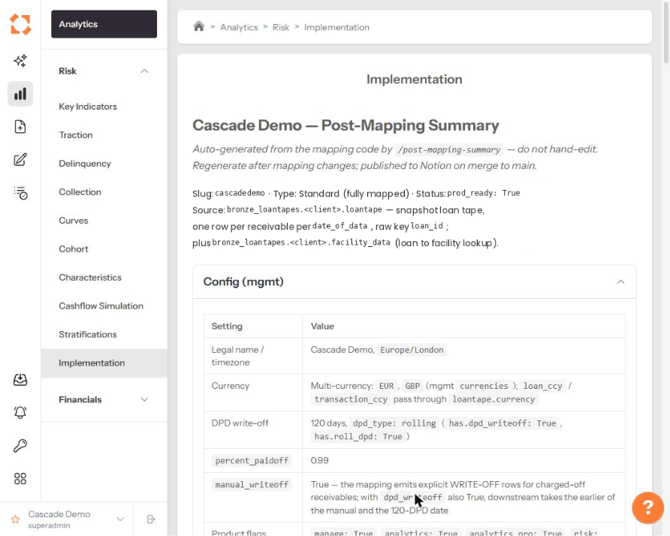
Five sections:
|
Section |
Contains |
|
Config |
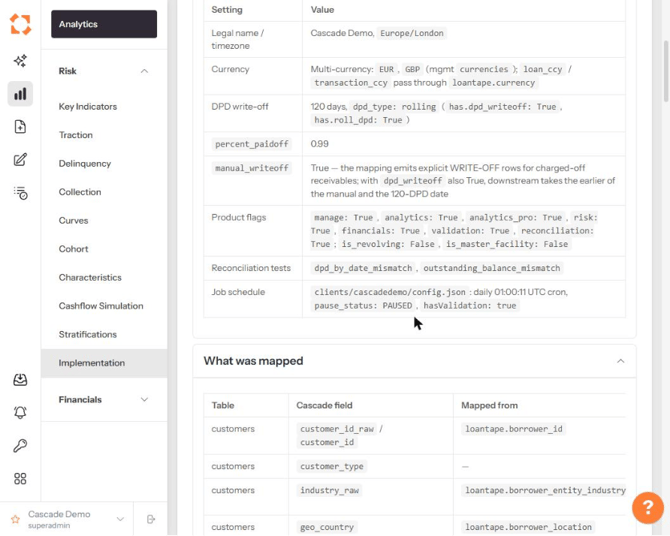
The client-level settings every calculation inherits: timezone, currencies, the DPD write-off threshold and method, percent-paid-off, write-off behaviour, which products are enabled, which reconciliation tests run, and the job schedule including its cron and whether it is paused. |
|
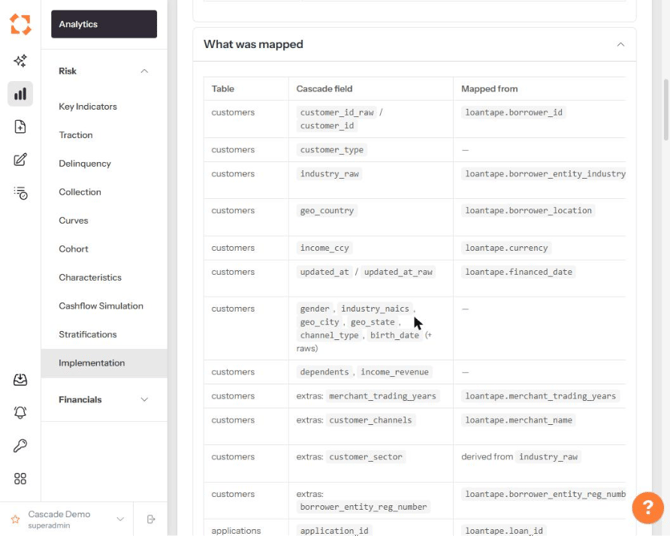
What was mapped |
Every Cascade field, the raw column it came from, and the logic applied. Dozens of rows across customers, applications, loans and transactions — including which fields are hardcoded, which are null-blocked, and how each transaction type is constructed. |
|
Applied logic & assumptions |
Prose explaining the judgement calls: how duplicate snapshots are resolved, how customers are derived, how fees are treated at funding, how payments are aggregated, how write-offs are dated, how number formats are cleaned. |
|
Filters |
What each filter in the Analytics UI is actually built from — so you know what "Customer Sector" or "Internal Rating" means before you slice by it. |
|
Change log |
A dated record of every mapping change. |
Why this matters
When a client says "your charge-off number doesn't match ours", the disagreement is almost never arithmetic. It is a definitional difference — a different write-off trigger, a different treatment of partial payments, a different cohort basis. This document surfaces those definitions so the conversation starts at the right place.
Analytics Pro > Implementation — the chart specification
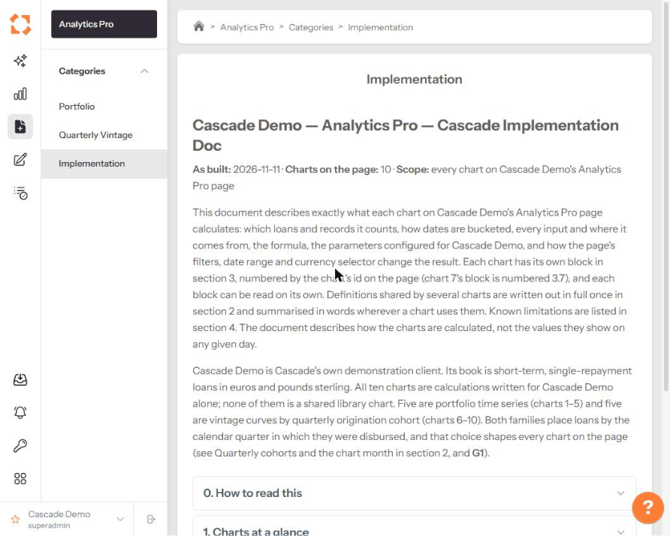
This document covers every chart on the Analytics Pro page: which loans and records it counts, how dates are bucketed, every input and where it comes from, the formula, the parameters configured for your deal, and how the page's filters, date range and currency selector change the result.
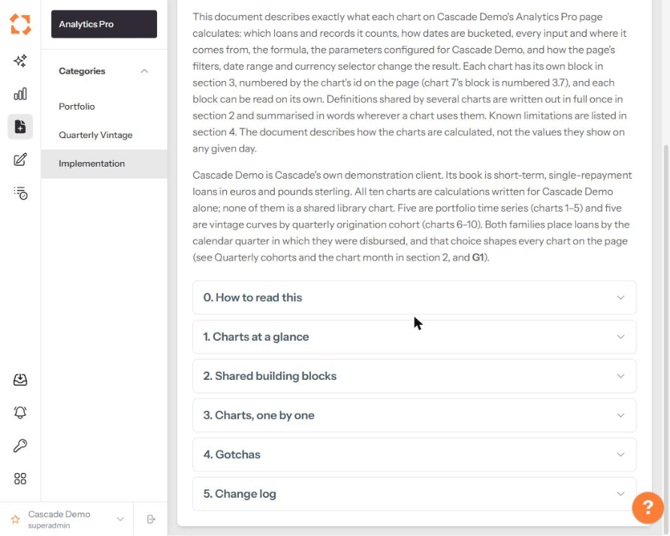
|
Section |
Contains |
|
How to read this |
Conventions used throughout the document. |
|
Charts at a glance |
Every chart on the page, summarised. |
|
Shared building blocks |
Definitions used by more than one chart — cohort basis, date bucketing, balance definitions — written out in full once. |
|
Charts, one by one |
A self-contained block per chart, numbered to match the chart's position on the page. |
|
Gotchas |
Known limitations. |
|
Change log |
Dated record of changes. |
Manage > Facility Details > Implementation — the facility baseline
This is the deepest of the three. It describes what Cascade computes for one specific facility and nothing else — every query behind it is scoped to that facility id.
It is also the one with a direct counterpart. The Details tab beside it holds Cascade's extract of the executed legal documents; this tab holds what was built from them. Where the agreement sets a concentration limit, Details carries the clause and Implementation carries the rule that enforces it — with its exact test, its ordering, and whether it has ever actually removed anything.
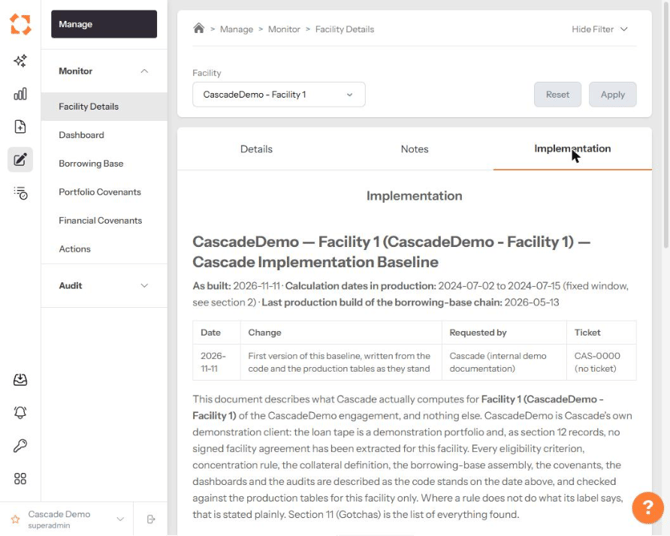
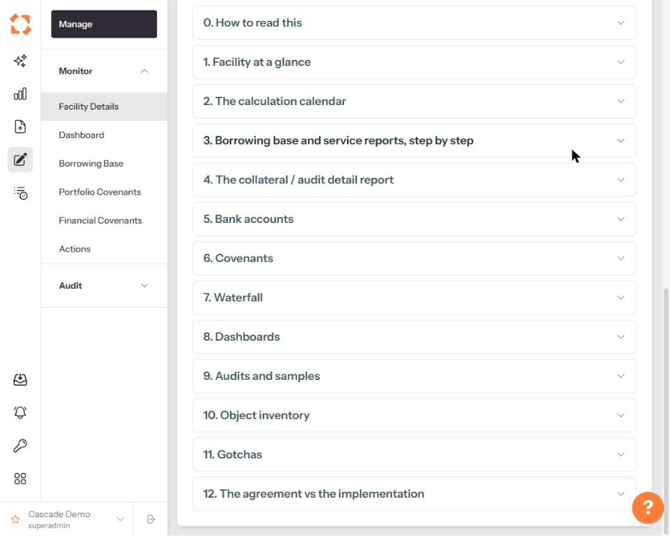
|
Section |
Contains |
|
0. How to read this |
The source tagging system — every field is tagged by where it comes from: raw loan tape, transaction file, financial statements, deal configuration, FX reference data, Cascade-calculated metrics, or a Cascade calculation. Also the currency convention. |
|
1. Facility at a glance |
Every deal-configuration value: parties, committed amounts, agreement and draw-period dates, agreement currency, pool count, interest method, withholding tax, enabled modules, reporting cadences, registered bank accounts, covenants and dashboards. Plus an effective-date timeline showing every dated switch and whether it actually binds. |
|
2. The calculation calendar |
How calculation dates are produced — and therefore why a borrowing base exists on some dates and not others. |
|
3. Borrowing base, step by step |
The full build: which receivables reach the calculation, how loan state is assembled, every eligibility criterion with its exact test, pool assignment, FX treatment, the discount grid, every concentration rule with its limit and removal logic, advance rate, cash, and then the report line by line with the formula behind each line. |
|
4. Collateral / audit detail report |
Every column in the receivable-level drill-down, what it means, where it comes from and how it is derived — plus how each borrowing-base line ties back to a sum over this report. |
|
5. Bank accounts |
Which accounts are registered, which are reporting, reconciliation findings, and the operational consequence of any gap. |
|
6. Covenants |
Per covenant: the plain-English definition, every input and its source, the exact formula, the threshold actually tested, the direction, the bad-debt definition, seasoning and waiver treatment, and the coverage in production. |
|
7. Waterfall |
The waterfall, or a statement that none is calculated. |
|
8. Dashboards |
Every chart, the rule it is linked to, its calculation, its marker, and whether it renders. |
|
9. Audits and samples |
How the payment and underwriting audits select items — every tier and what it flags. |
|
10. Object inventory |
Every calculation, configuration register and report behind the facility, with row counts and date coverage in production. |
|
11. Gotchas |
Known defects and surprises, each with where it sits and its current impact. |
|
12. The agreement vs the implementation |
The formal comparison between the two tabs: what the executed agreement requires, set against what the code does. Where a term has no counterpart in the build, or has one that behaves differently, it is recorded here. |
The Gotchas section
Both the facility baseline and the Analytics Pro doc carry a Gotchas section. It is a numbered list of everything found where the implementation does not do what you would assume — a rule whose label overstates it, a value that is not converted where you would expect, a calculation frozen by a hard-coded bound, a chart that does not render.
Each entry names the finding, where it sits, and its current impact. Findings are cross-referenced from the body of the document, so where a section describes behaviour that has a known wrinkle, it points you at the gotcha.
This is unusual and it is deliberate. A specification that only describes the happy path is not a specification you can audit against. Read this section before you rely on a figure in a certificate or an investor report — and before you escalate a number you think is wrong, because the answer is often already written down.
How to use these documents
- Before onboarding sign-off. Read the Post-Mapping Summary end to end. The Applied logic & assumptions section is where the decisions that will shape every downstream number are recorded. Disagree with them now, not in month six.
- When a client disputes a figure. Find the calculation in the relevant Implementation doc and quote the definition. Most disputes resolve the moment both sides are looking at the same definition.
- Before a covenant conversation. Section 6 of the facility baseline gives you the exact formula, the threshold actually tested, and the bad-debt definition — including where the threshold in the covenant register differs from the one being tested. Check the clause in the Details tab alongside it.
- When you need to show that the build matches the deal. Open Details and Implementation side by side, and read section 12. This is the comparison an auditor, an investor or a rating agency will ask for.
- When something looks frozen or missing. Section 2 and the Gotchas list usually explain it, with the reason and the operational consequence.
- When a figure must be defensible. Section 10's object inventory tells you which calculation produced it, over what date range, and how many rows exist in production.
How they stay current
The Analytics summary is generated from the mapping code and regenerated after mapping changes. The facility baseline is written from the code and the production tables as they stand on its as-built date, and carries both that date and the date of the last production build — so you can see at a glance whether production is running the code the document describes.
Each document carries a change log recording what changed, when, who requested it and the ticket reference.