![cascade-lockup-dark.png]](https://knowledgebase.cascadedebt.com/hs-fs/hubfs/Logos%20(new)/cascade-lockup-dark.png?height=40&name=cascade-lockup-dark.png)
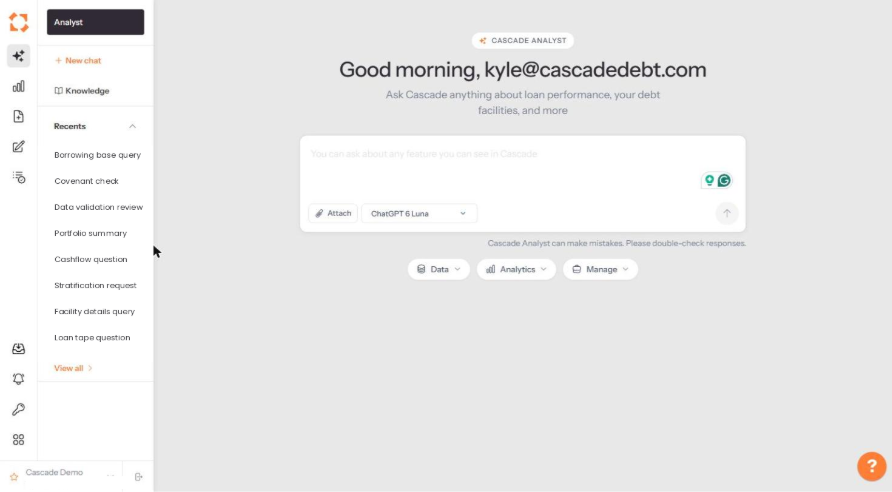
The modules
|
Icon |
Module |
What lives there |
|
Sparkle (top) |
Analyst |
Cascade Analyst — ask questions in plain English. Also Knowledge, where you set standing instructions and upload reference files. |
|
Bar chart |
Analytics |
Risk dashboards (key indicators, traction, delinquency, collection, curves, cohort, characteristics, cashflow simulation, stratifications), an Implementation section documenting how your data was mapped, and Financials (key indicators and statements). |
|
Document |
Analytics Pro |
Portfolio charge-off and DPD curves, quarterly vintage analysis, and an Implementation section documenting what every chart calculates. |
|
Pen |
Manage |
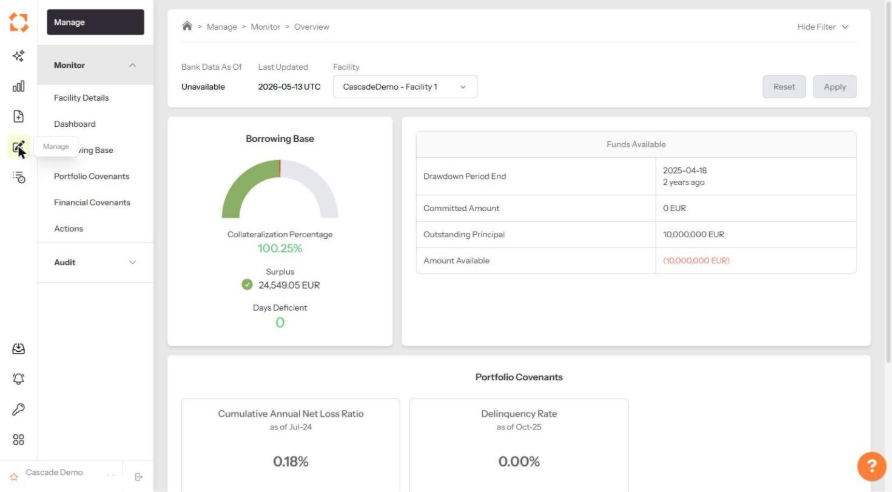
Monitor your facility — facility details, dashboard, borrowing base, portfolio and financial covenants, and Actions. Plus Payment and Underwriting Audits. |
|
List |
Data |
Exports (generated exports and loan tapes), Data Validation, and Insights. |
Three further icons sit at the bottom of the rail:
|
Icon |
Opens |
What it is for |
|
Inbox with arrow |
Reports Progress |
Background report and export jobs, with download links when they finish. |
|
Bell |
Notification Center |
Your alert inbox and the full event log. |
|
Grid |
Administration |
Onboarding progress, data source connections, accounting configuration and user management. |
The second panel
Selecting a module opens a second panel listing its pages. Sections with a chevron expand and collapse. The small circular arrow on the panel's right edge collapses the whole panel to give the content more room.
The filter bar
Most content pages carry a filter bar across the top. It typically shows the data as-of date, when the page was last updated, and selectors for facility, currency, date range or legal entity. Change what you need, then click Apply — the page does not refresh until you do. Reset returns the filters to their defaults, and Hide Filter collapses the bar.
Implementation sections
Analytics, Analytics Pro and Manage each carry an Implementation section documenting exactly what Cascade built and why. They are the platform's audit trail. See Implementation: How Everything Was Built.
Your account
The foot of the second panel shows the company you are currently viewing and your role. Click it to switch companies — see Switching Between Companies and Facilities. The icon beside it signs you out.